Know exactly which rental strategy wins before you buy
Analyze any property for long-term vs short-term rental returns using real market data. AI-powered insights. No spreadsheets required.
No account needed · See grade, cash flow & CoC return instantly
Free plan includes 5 credits/month. No credit card required.
Powered by
Zillow
Property data
AirDNA
STR market data
RentCast
Rental estimates
50+
US markets
3 sources
per analysis
10-year
projections
Everything you need to analyze smarter
Built specifically for real estate investors who want data, not guesswork.
LTR Analysis
Full long-term rental projections including cap rate, DSCR, cash-on-cash return, and monthly cash flow. Override any assumption to model your exact scenario.

10-Year Projections
Year-by-year breakdown of equity growth, appreciation, cash flow, and IRR. See your total return if sold at any point in the hold period.
STR Analysis
Short-term rental revenue forecasts, occupancy rates, and net operating income from real AirDNA data. Customize nightly rate, OTA fees, and occupancy assumptions.
AI Chat Assistant
Ask any investment question and get data-backed answers. The AI knows your market and your property.
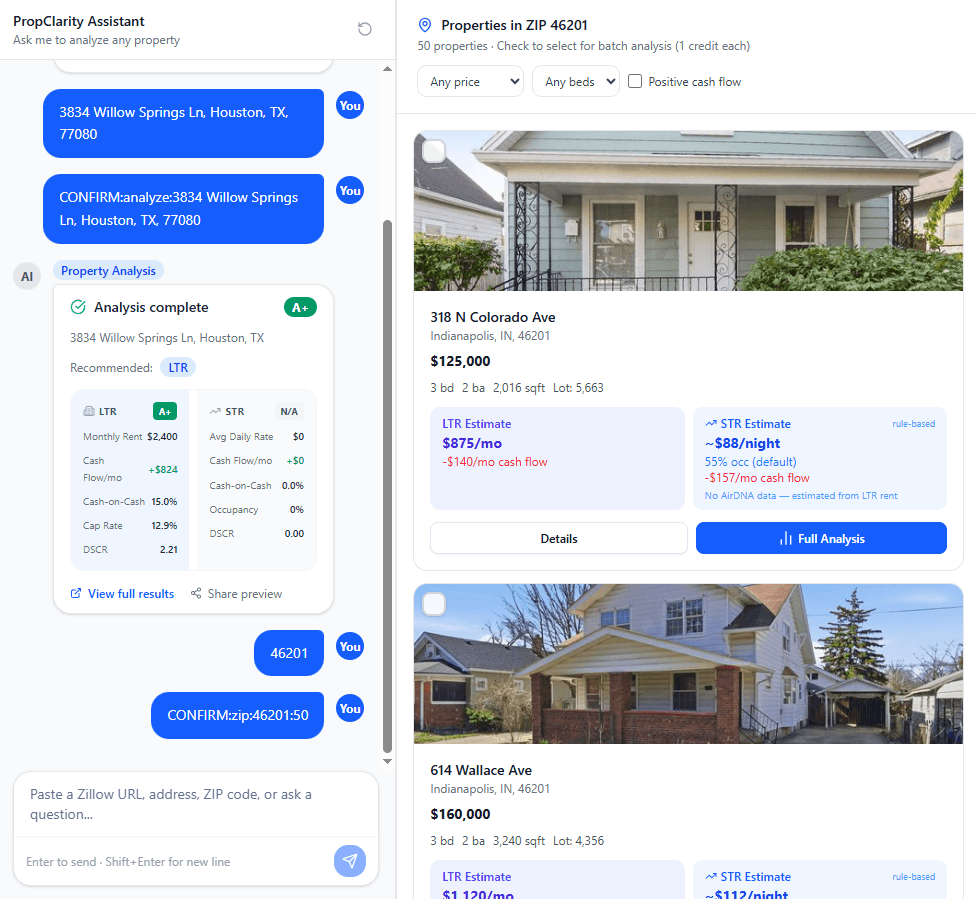
ZIP Code Search
Discover investment opportunities by market. Search any ZIP and browse properties with instant estimates — uses only 0.5 credits.
Portfolio Tracking
Save properties at every stage from prospecting to owned. Edit assumptions, track actual vs projected performance, and revisit past analyses.

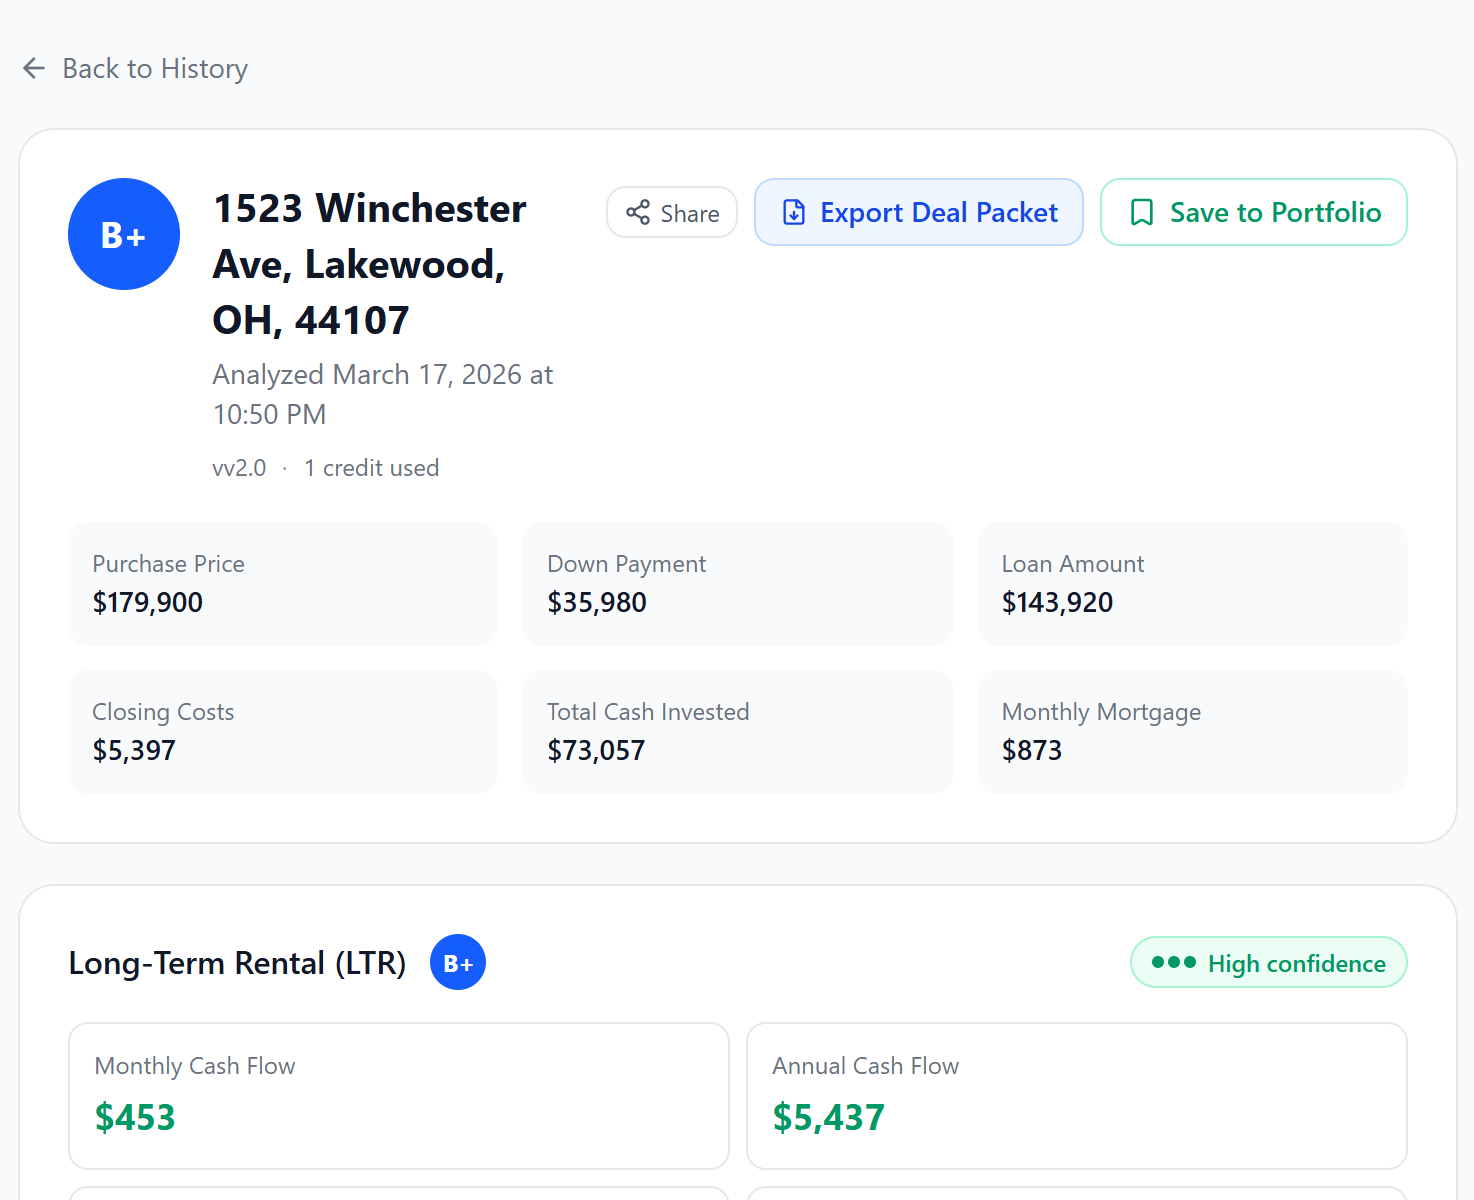
Deal Packet Export
Generate a professional PDF deal packet with full LTR/STR analysis, 10-year projections, and property photos. Share with partners or lenders. Pro plan.
Share Analysis
Share any analysis with partners, lenders, or clients via a shareable link. No account required to view.
Up and running in minutes
No setup. No configuration. Just paste a property and go.
Enter any property
Paste an address, Zillow URL, or ZPID. We pull live data from Zillow, RentCast, and AirDNA automatically.
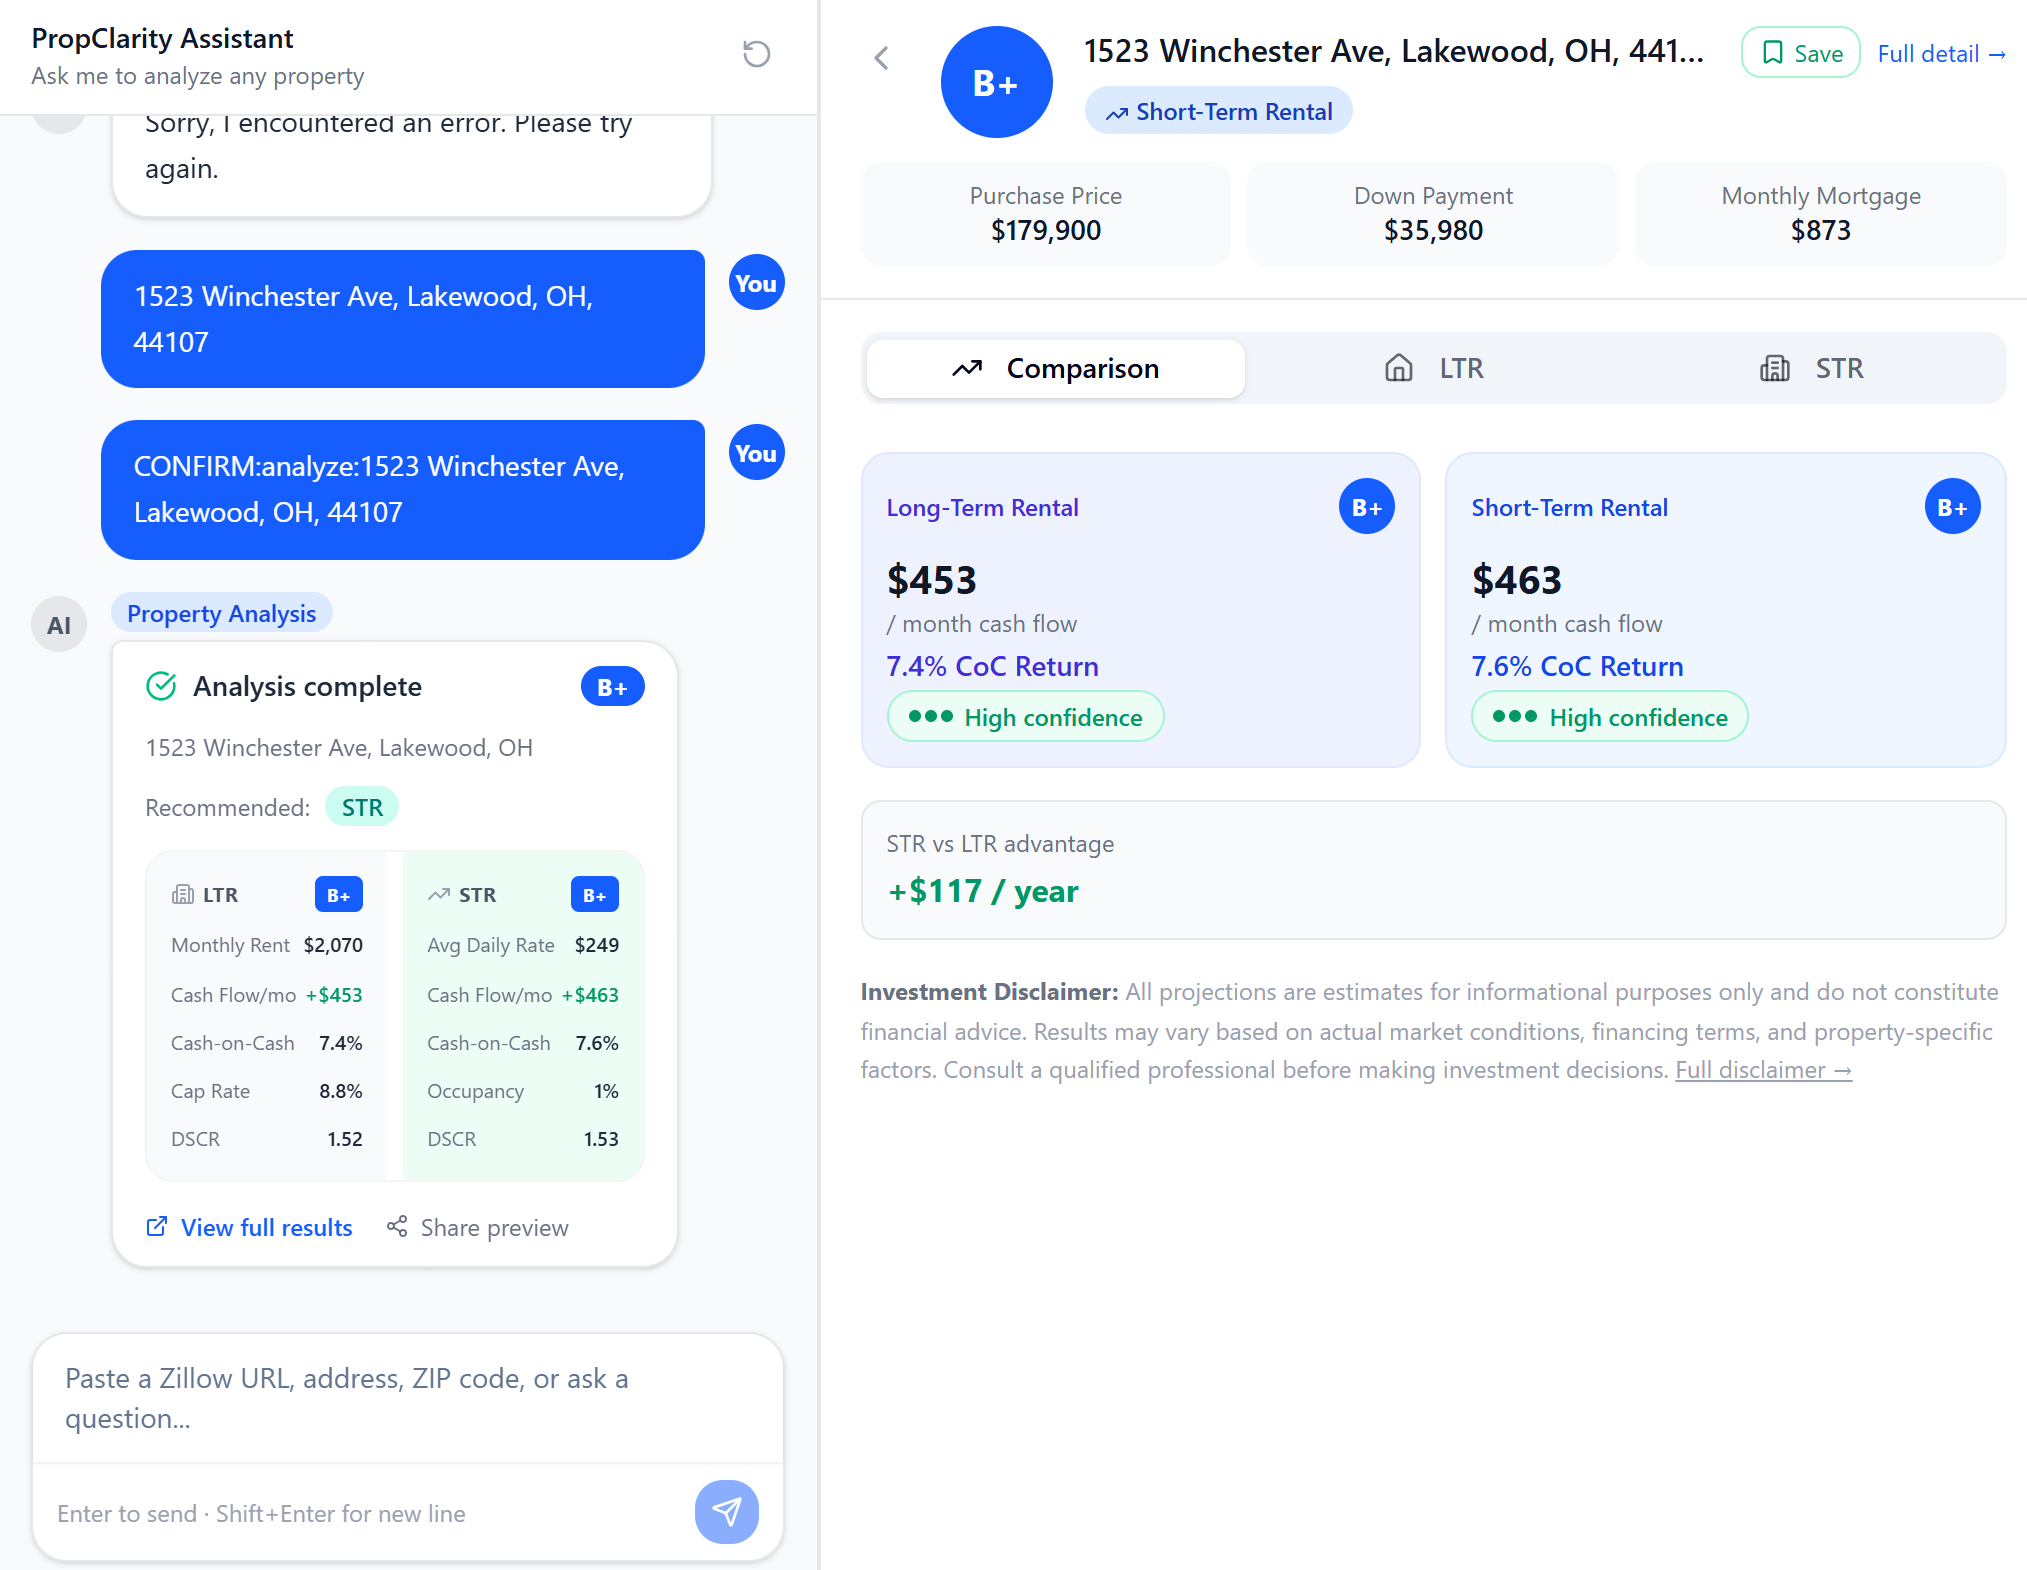
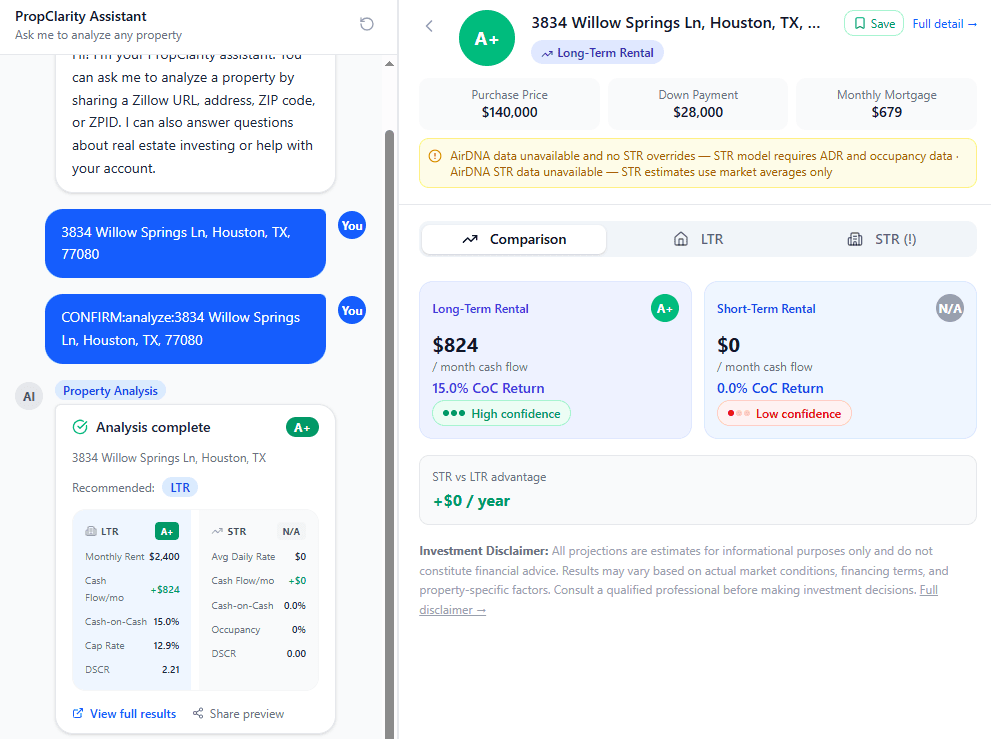
Get instant LTR vs STR analysis
See a full comparison of long-term and short-term rental returns with grades, cash flow projections, and a clear recommendation. Includes 10-year equity, IRR, and total return if sold.
Track, share, and optimize
Save to your portfolio, adjust assumptions to model custom scenarios, compare projections to actual performance, and share analyses with partners or lenders.
Investors are already making smarter decisions
Early access feedback from real estate investors using PropClarity.
“I was about to put an offer on a property assuming it'd do great on Airbnb. PropClarity showed me the LTR numbers were actually better — and why. Saved me from a bad call.”
Marcus T.
Real estate investor · Austin, TX
“The 10-year projections are what sold me. I can finally show my business partner a clear model instead of a back-of-napkin spreadsheet. The Deal Packet PDF is a game-changer for lender conversations.”
Priya N.
Portfolio investor · Phoenix, AZ
“I use the ZIP search to scout new markets before I even visit. Seeing STR vs LTR broken down by neighborhood gives me a real edge on where to focus. Nothing else does this.”
Jordan K.
Short-term rental operator · Nashville, TN
Explore Rental Markets
See how STR compares to long-term rental in the markets investors are searching right now.
Want your market? Analyze any ZIP code free →
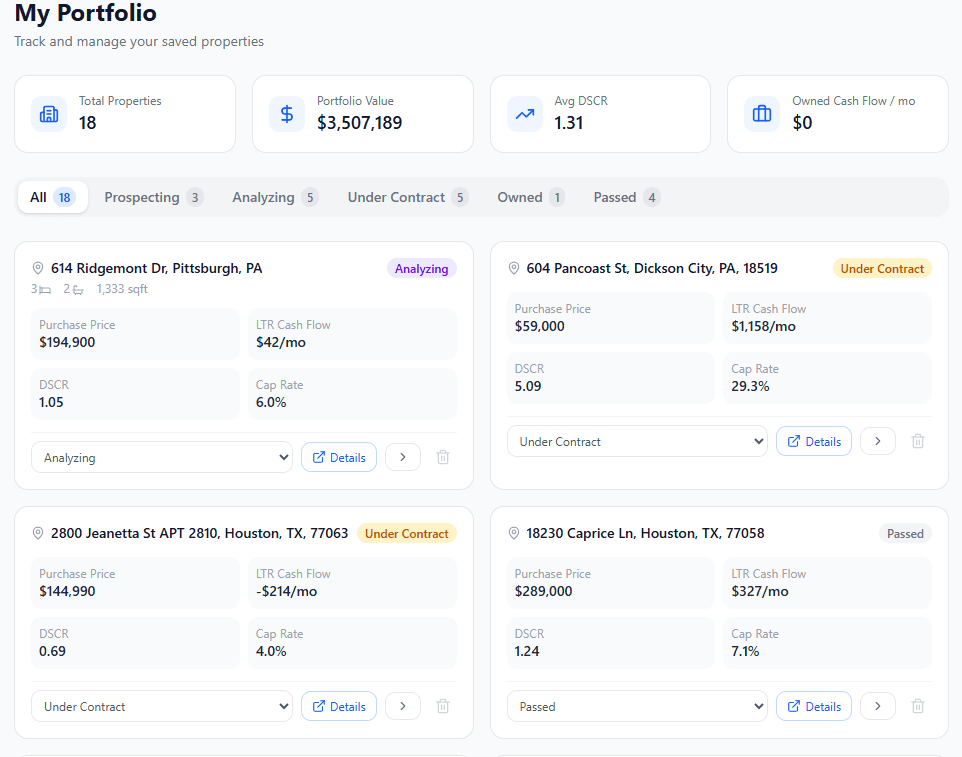
Track every deal from first look to closing
Save properties to your portfolio and move them through stages as your deal progresses. Override assumptions to model real-world scenarios, then record actual performance once you own it.
- 5 pipeline stages: Prospecting, Analyzing, Under Contract, Owned, Passed
- Override any assumption — purchase price, interest rate, management fee, and more
- Record actual rent and expenses separately from projections to compare real vs expected
Simple, transparent pricing
Start free. Upgrade when you need more analyses.
Free
- 5 credits/month
- Full LTR + STR analysis
- ZIP code search (0.5cr)
- AI chat assistant
- Analysis history
Starter
- 50 credits/month
- Up to 5 portfolio properties
- Full LTR + STR analysis
- Credit rollover (1 cycle)
- 14-day free trial
Pro
- 200 credits/month
- Unlimited portfolio properties
- Full LTR + STR analysis
- Deal Packet PDF export
- Priority support
- 14-day free trial
Pay-as-you-go
10 credits for $15 — one-time purchase, credits never expire. Works alongside any plan.
Start analyzing smarter today
Free plan. No credit card required. Your first 5 credits are on us.